The EightThirtyTwo ISA – Part 21 – 2020-04-12
One facility that’s so far been sorely missing from the EigthThirtyTwo CPU is any form of provision for on-chip debugging. That is about to change!
What I want to be able to do is connect remotely to a running 832 instance, set breakpoints, read register contents, read and write to memory and single-step through a program.
In order to do this I need some way of communicating with the CPU. If we can make use of the USB-Blaster for this it would be ideal. My initial idea was to build upon the JTAG UART I talked about in a previous post, and write a backend application using the undocumented libatlantic linker library. I’ve since discovered that there’s a better (or at least less hacky) way, which involves using the Virtual JTAG IP core supplied with Quartus.
This allows you to establish serial communication with the quartus_stp program which runs on the host PC, which itself can be made to run a custom TCL script. TCL is not something I’ve explored, and it’s been quite an eye-opener to see just what can be done in this language. It would be perfectly possible to write the entire debugger application in TCL – but I’m not going to. What I’m going to do instead is have the TCL script open a TCP/IP port (33581, to be precise: in hex, 0x832D!) and communicate with a debugging frontend written in C.
The chain thus looks like this:
[CPU] <–> [VJTAG core] <–> [USB-Blaster] <–> [TCL script] <–> [Debugger]
Rather than embed the Altera/Intel-specific VJTAG core inside 832, I’ve defined an external interface for debugging, with a Bridge component responsible for marshalling data to and from the Virtual JTAG core. This means it would be perfectly possible to create alternative bridges to route the data over whatever Xilinx’s equivalent is, or even over RS232 serial. Likewise, I shall make the debugging frontend’s connection-handling code abstract and generic enough that it can be easily retargetted to alternative connection types.
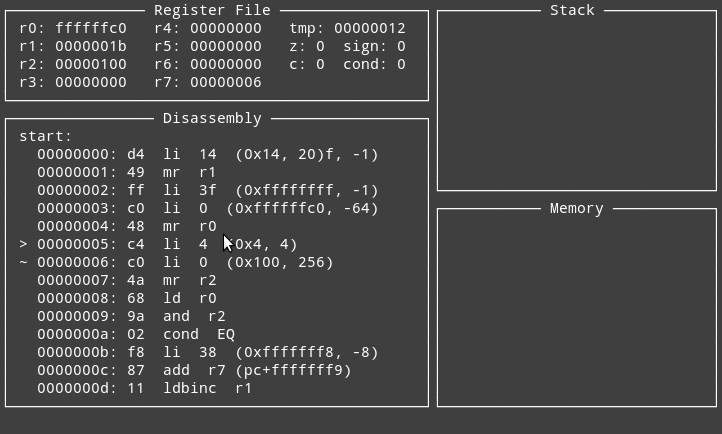
The frontend itself will be ncurses based – which is also a new departure for me! The debugger is still in the very early stages, but I can now read registers, scroll through the program display and single-step through the program. The JTAG link is rather slow, which echoes what I found with the previous JTAG-UART experiments – but blinding speed isn’t necessary for this application.

