2025-11-22
Some months ago I had the idea of improving the prefetch on the TG68K soft CPU in order to reduce the amount of time it spent waiting for the cache / SDRAM.
In the Minimig core on MiST / SiDi128 / Turbo Chameleon 64 we run the CPU on a 114MHz clock, but only allow it to run one cycle in four. It takes more than one cycle for the CPU’s address signal to be stable, so most of the time we have to wait a couple of cycles before performing any action based on that address (such as fetching data from the cache or SDRAM).
I was hoping to take advantage of the fact that most of the time instructions are fetched from a monotonically-increasing address. If we know the next fetch address in advance we can eliminate a small amount of waiting. We don’t know the next fetch address when the CPU branches, however – we don’t have branch prediction – so I set out to find some clue within the CPU as to when program flow is about to change, and found several signals that will help.
I found that the following line of code reliably tells me when the program counter is about to change:
newpc <= '1' when exec(directPC)='1' or exec(ea_to_pc)='1' or TG68_PC_brw='1' else '0';A false positive here wouldn’t be disastrous, but a false negative would – but all my testing so far suggests that no false negatives sneak past this test.
The first question we should be asking is how much benefit can we expect to see from making improvements here? From my previous work on the cache (detailed in an earlier post), I was reminded that it’s a mistake to make assumptions about where the bottlenecks are, and instead I should be measuring – so how can I meaningfully measure the time lost to waiting for the CPU’s address to be stable?
What I chose to do was create a module accessible over JTAG which logs the number of cycles spent performing various types of access, as well as the total number of cycles elapsed over the same timespan.
When the CPU fetches an instruction word from Amiga Fast RAM in the current MiST MinimigAGA core, one of the following will happen:
- The word is in the current cacheline: 4 cycles
- The word is not in the current cacheline but is in the main cache: 6 cycles
- The word is not in either the current cacheline or in the main cache: typically between 8 and 24 cycles.
Scenario 1 is already as fast as it can be, since when clocked at 114MHz the TG68 can only be enabled for 1 cycle in 4.
In both scenarios 2 and 3 we could potentially get a head start on fetching if we know in advance whether or not program flow is about to change, since if it’s not changing we can predict the next fetch address.
So if the goal is to reduce the cycle count for each scenario as much as possible, ideally to 4 cycles, the first step is to determine how far away we are from that ideal situation, and thus how much room there is for improvement, and to that end I’ll count the following:
- Cycles spent fetching from cache (2 cycles per event, since each fetch takes 6 cycles, and 4 cycles is the theoretical ideal)
- Cycles spent fetching from RAM (total cycles taken, less the 4-cycle theoretical ideal.)
Further, I split these and maintain separate counts for when the program flow is and is not about to change.
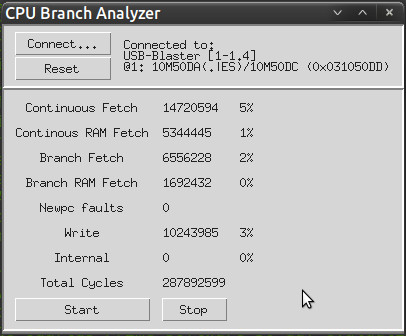
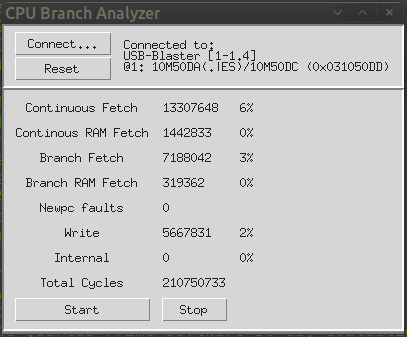
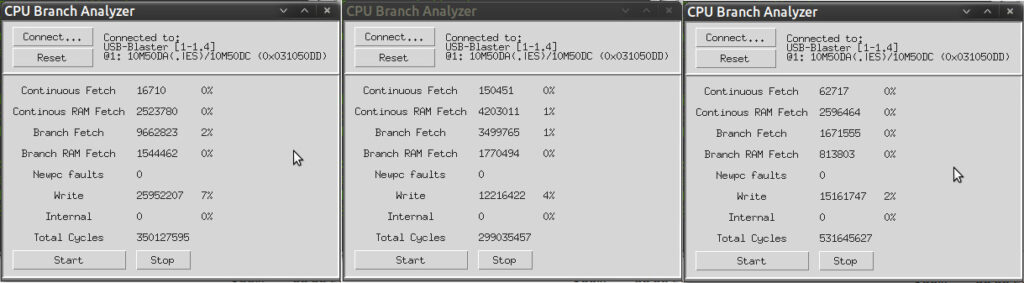
So let’s see what the numbers look like while running a few Amiga programs.
Firstly, the “Savage” benchmark in Amiga Intuition Based Benchmark (AIBB):

…and DoomAttack:
…and reassembler’s amazing port of Outrun to the Amiga:
(As you can see, I’ve logged some other details, too – including how much time’s spent waiting for writes to complete, and how often the prediction of when the program counter will change has failed – thankfully zero!)
So what can we determine from these captures?
Firstly, re-iterating what I found in my earlier experiments, the cache is working very well, and the amount of time spent waiting for actual RAM access is very small – accounting typically for between 0.5 and 1.5 percent of the total number of cycles. In other words, there’s little point in trying to improve this aspect.
Secondly, the 2-cycle penalty we currently suffer whenever the program counter moves from one cacheline to the next, without branching, is accounting for somewhere between 4 and 6 percent of the cycles spent running intensive tasks, so that’s the degree of speedup we can expect if we can generate the fetch address in advance.
This took me far longer than it should have done and I ended up rearchitecting the cache somewhat, splitting it into completely separate instruction and data caches and simplifying the instruction cache. It does now work well, and continuous linear instruction fetches now almost always take 4 cycles as long as they’re in cache. Let’s see how it does with the same three test workloads as before – AIBB’s Savage benchmark, DoomAttack and Outrun, respectively:
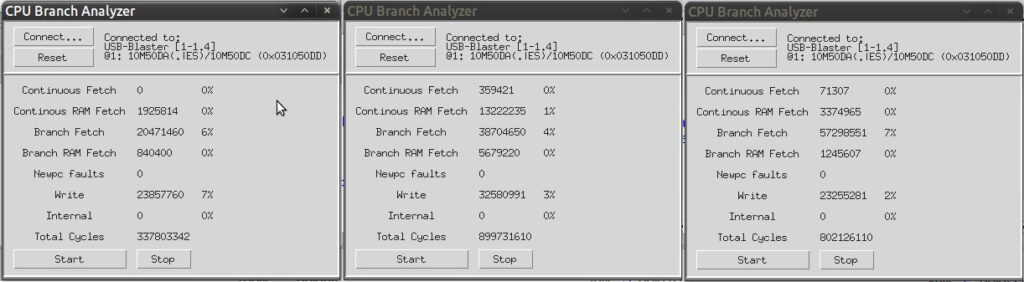
As expected, continuous fetching is as close to optimal as makes no difference – the remaining delays will be from situations where the cache is busy filling a cacheline from SDRAM and can’t respond to a fetch until that’s done – but the numbers are so small as to be lost in the noise, so this isn’t worth worrying about.
What is worth worrying about is that the percentages for cache-fetch-on-branch have gone up! Partly this is just because thanks to the improvement in continuous fetch, the branch fetches now account for a larger proportion of the overall cycles, but another reason is that my changes have brought with them a one-cycle penalty when the program counter changes. This is more than offset by the speedup during linear access in the test workloads I’ve examined, but having gone to all that effort I wanted to take it a bit further still – and it would be nice to do something about that one-cycle penalty…
I said earlier that we don’t have Branch Prediction in the TG68 CPU, and adding it would definitely not be a simple task. However, since we now know when the program counter is about to change, it would be fairly straightforward to maintain a Branch Target Buffer:
When control flow changes, we can simply record the new fetch address in a cache, using the previous fetch address as a key. Then, when we detect that the program counter is about to change, we can use the current PC to look for a cache entry, and if found, use that entry as a fetch address. Obviously we have to verify that the address is correct, but we can do that at the very last minute and restart the fetch if it turns out that we mispredicted.
There will, of course, be pathological access patterns where this scheme is actually slower, but the most common scenario – tight inner loops which need to run as fast as possible – will certainly benefit.
Having implemented the Branch Target Buffer, how do the numbers look?
Once again, the same three testcases – AIBB’s Savage benchmark, DoomAttack and Outrun. Writes are now accounting for more delays than any of the fetch scenarios, and Outrun, in particular, is running very nearly optimally.
At the end of the day this was a lot of work for what amounts to a speedup of no more than 5% in most benchmarks. Nonetheless it was an interesting problem to solve, and with these changes Outrun’s framerate drops from 25fps to 17fps noticeably less frequenctly, so I consider it worthwhile.
Rather than push such highly experimental code to the main MiST/SiDi128/TC64 codebase, I’ve created a separate fork of the MinimigAGA codebase to contain this and any future experiments which might have side-effects. Anyone who’s interested can find it at: https://github.com/robinsonb5/MinimigAGA_Experimental